Indicators and certain bar configurations may strongly suggest the next price move, especially when they appear together and offer some confirmation, but it is always possible that some piece of news will come out and totally trash the indicated price move.
We have all seen cases where three or four “leading” indicators all point in the same direction, and yet the expected price move does not materialize. Indicators only indicate, they do not dictate, and it is a sad fact that we do not have reliability statistics on indicators. If you want to compute a reliability quotient for your indicators, you have to do it yourself. Bottom line: so-called leading indicators are very often wrong.
Leading Indicators
Welles Wilder noted that a change in momentum is often (but not always) a precursor to a change in direction. The model is for momentum to start modestly, accelerate rapidly as the bandwagon forms, peak when nearly all the buyers or sellers have taken positions, and then tail off, whereupon the earliest of the early birds begin to take profit and that sets off a move in the other direction.If you can identify the acceleration and deceleration of momentum, you can anticipate the peaks and troughs, and position accordingly. The top leading indicators are therefore the ones built on momentum:
You can use plain old momentum or rate-of-change to identify the stages of momentum. The chart below is showing momentum, calculated as the close today divided by the close 12 periods ago. We see momentum falling as the price falls, but then momentum stops falling and starts to rise. We get one more lower spike low, but it is a dragonfly doji, which we interpret as bullish. Sure enough, momentum was a good leading indicator and the price proceeds upward. After the small move up, momentum peaks on exactly the same day as the price peaks and then falls alongside the price. Here it is a coincident indicator.
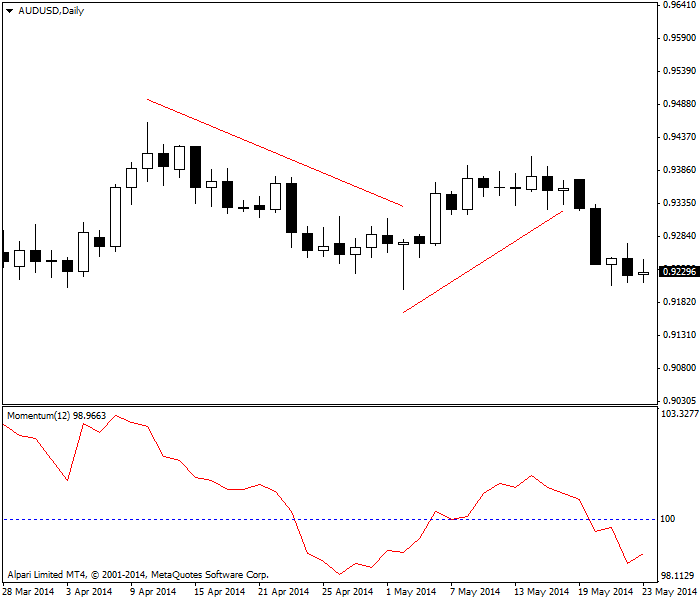 |
| Momentum indicator leads then coincides. |
The next chart is the same one as the previous but with ATR added. The horizontal blue line marks where ATR stops falling and is flat, and it even rises a little, but it does not get really sizeable. After the flat region, ATR falls again, telling you that the mini-rally identified by rising momentum is a flash-in-the-pan and not to be trusted. A real rally would have rising ATR.
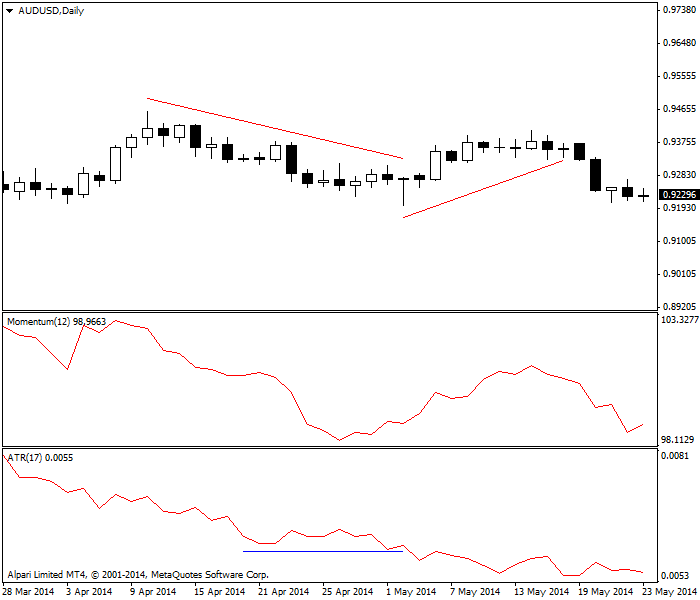 |
| Fading ATR suggests a fading trend. |
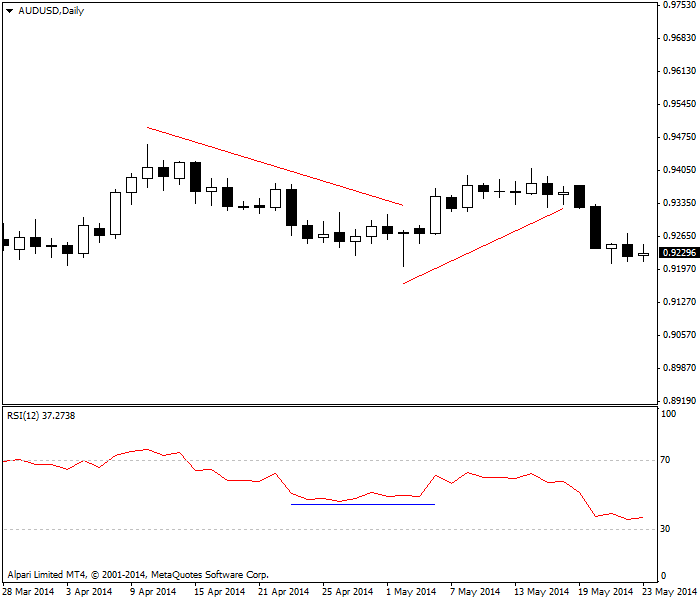 |
| RSI as a leading momentum indicator |
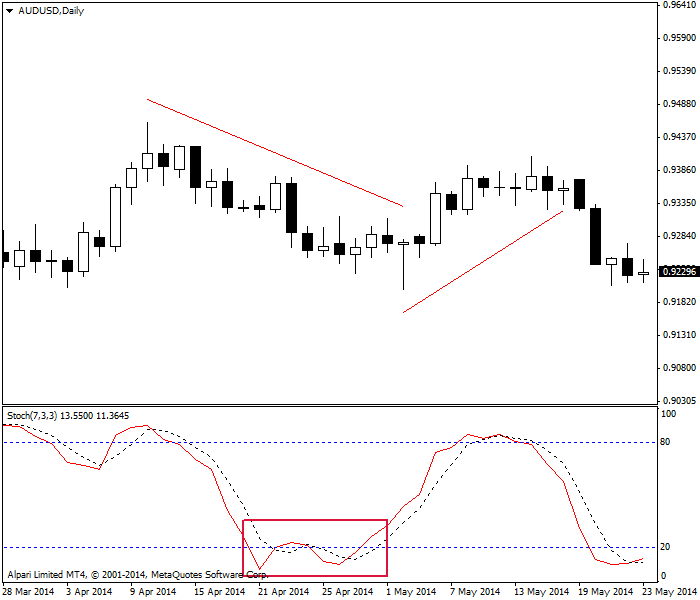 |
| Stochastic oscillator as a leading indicator with a false signal in red box |
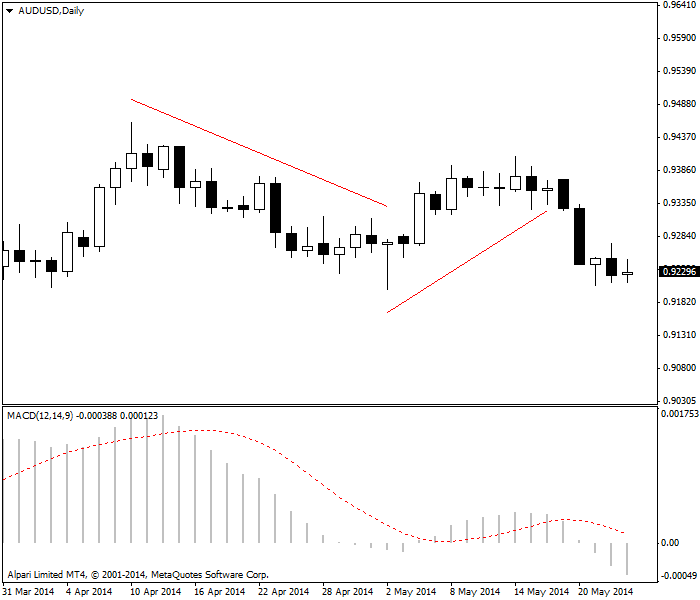 |
| MACD is not providing any tradable signals here |
Bars, bar configurations, and patterns are as good as leading indicators, if not better, as arithmetic-based indicators. A breakout of a support or resistance line tends to be a reliable leading indicator. A number of bars configurations, including candlesticks, have high predictive value, like spinning tops, hammer and hanging man, etc. Other fairly reliable patterns include double top and bottom, gaps, and island reversals.
Lagging Indicators
Any indicator based on a moving average is, by definition, lagging. The benefit of lagging indicators is their reliability quotient. By the time you get a moving average crossover using 5 and 10 periods, or 10 and 20 periods, for example, the probability of your trade being in error is quite low. The next chart is showing the 5-period moving average crossover of the 10-period, with the 12-period momentum in the top window. In this instance, the vertical lines mark the crossovers and they happen to coincide exactly with the dates when momentum was signaling buy or sell. Usually momentum leads by a few periods, but never mind — the point is that using a leading indicator together with a lagging indicator is to apply the confirmation principle. Because no indicator is reliable all the time, the confirmation principle is a really good idea, especially if you scale in to the trade using a leading indicator for your first small position and add to it when you have agreement from a lagging indicator.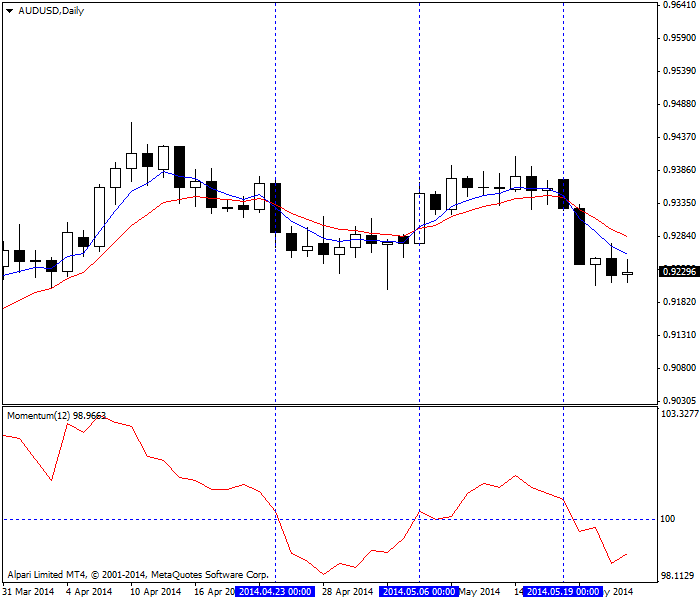 |
| Using moving averages and MACD together |
The final chart shows the same currency pair on the same timeframe, with breakouts of the Bollinger band marked with blue circles. Note that at each of the turning points, the long upper or lower shadow of the candlesticks coincides with the B-band breakouts — a form of confirmation.
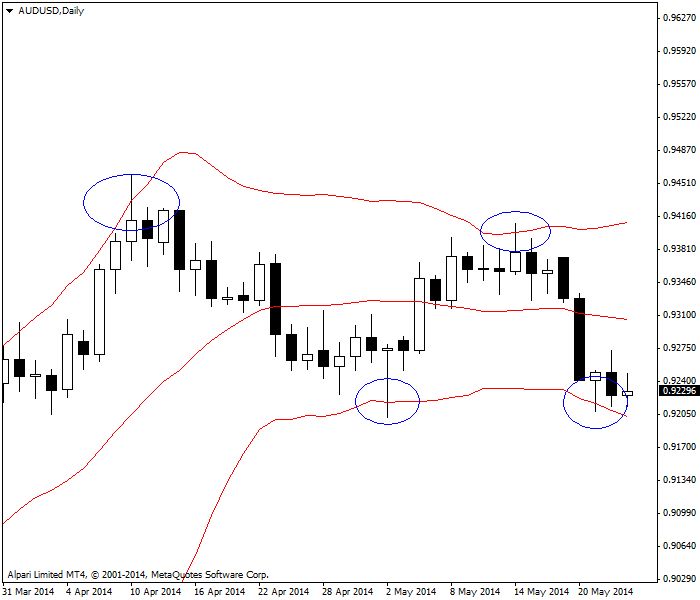 |
| Bollinger bands breakouts signal about reversals. |