Calculations
A moving average is a simple average of prices, almost always the closing price, to which you add the new period’s data and subtract the first period’s data to keep the number of periods constant. Say you have 10 periods worth of prices. You sum them up and divide by 10. The next period, you drop the first data point, add today’s new data, and divide by 10 again. By adding a period and dropping a period, the average “moves.”That would be a simple moving average. Each data point has an equal weight. You can also weight more recent data more heavily so that the moving average is closer to current prices and more representative of what is going on. There are two ways to do this — the exponential moving average and the weighted moving average. Technically, both are “weighted” moving averages. The first is weighted exponentially, and the plain “weighted” has individual progressive weights applied to each data point. All trading platforms offer these moving average variations, and so you do not really need to know how to calculate them by hand, although you can easily do it in Excel or similar software.
Weighted Moving Average
Let’s say, you have a series of 3 data points. You apply a weight of 3 to today, 2 to yesterday, and 1 to the first day. Today’s price is three time more heavily weighted than the price three days ago. In the example in the table below, the weighted moving average for USD/JPY comes out at ¥100.63, a little higher than the simple moving average but correctly reflecting the bigger price move between Day 2 and today.
Trick: You have to remember to sum the weighting factors
correctly. It is easy to forget that when you multiply by one, nothing
happens to the base amount, but when you add it to a series,
the series goes up by one. This may seem too obvious to mention, but
when you divide the weighted sums by 5 instead of by six, you can be
scratching you head to find your error.
| Day 3 | Day 2 | Day 1 (Today) | ||
| Price | 100.40 | 100.50 | 100.80 | |
| Factor | 1 | 2 | 3 | 6 |
| Weight | 1 × 100.40 | 2 × 100.50 | 3 × 100.80 | |
| 100.40 + | 201.00 + | 302.40 = | 603.80 / 6 = 100.63 | |
| Simple MA | 100.57 |
Exponential Moving Average
Instead of applying a fixed numerical weight, the exponential moving average is calculated by applying a “smoothing constant” which is fixed for each specific number of days in the moving average. The formula is;Smoothing constant = 2
N + 1
where N — the number of periods.
Examples:
- 10-day EMA = 2 / (10 + 1) = 18.8%
- 20-day EMA = 9.52%
- 50-day EMA = 3.92%
A comparison of three types of moving averages is presented on the figure below. The topmost red moving average is simple. The next blue one is exponential. The bottom one is purple weighted.
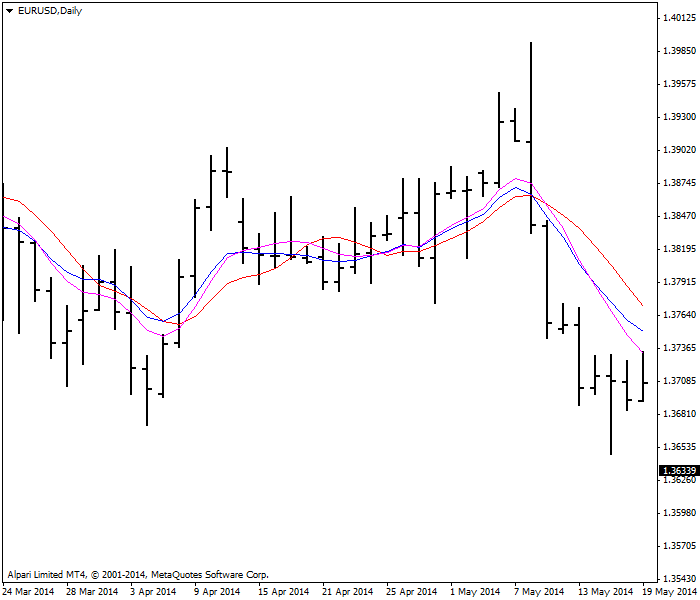 | |||
| Three types of moving averages:
— simple MA
— exponential MA
— weighted MA
|
Crossover Signals
An often-used technique is to consider the price crossing the moving average as a trading signal. For example, you place a 10-day moving average on your chart and buy when the price crosses above the 10-day, and sell when it crosses below the 10-day. This is a tried-and-true basic trading rule. See the example chart showing the price crossing above the moving average with the accompanying arrow denoting “buy.” On the right hand side of the chart, you see a crossover to the downside and an arrow pointing downward — the sell. If you had executed this exact trade, buying at the open on the day after the crossover and selling at the close on the day of the downside crossover, your gain would have been 147 points: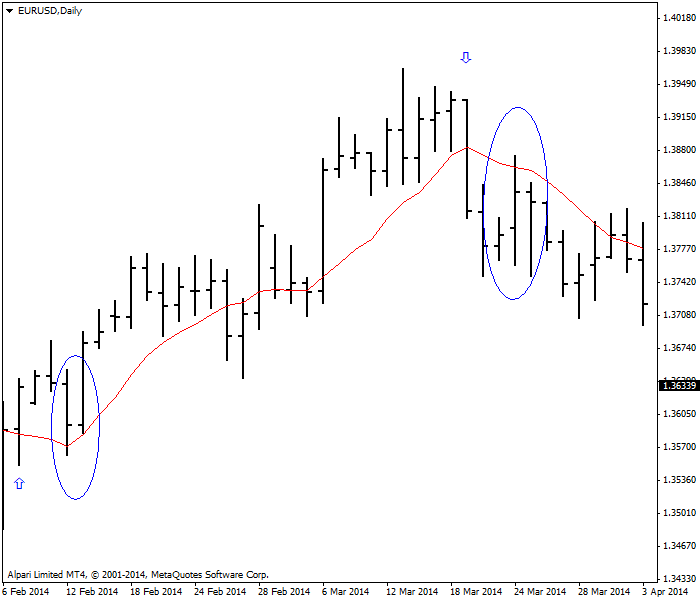 |
| Price and MA crossover trading strategy |
But right away, you can see the problem with this trading rule — sometimes the price will violate the moving average for only a day or two, as shown in the circles. In this case we ignored the one-day violation, but if you had obeyed the trading rule to the letter, you would have been whipsawed — exiting after only a day or two only to restore the original position. Whipsaws are very, very common in the price/moving average crossover trading rule. A possible solution is to require the price reverse by more than a single day, or by two or three. You can also add a safety cushion to the moving average, which ideally would be based upon the historical record of the optimum number of points to add or subtract in order to avoid being whipsawed. Note that the optimum number of points for a false downside crossover is probably different from the optimum number of points for a false upside crossover due to trending bias, and the optimum number of points will change over time as the currency becomes more or less volatile.