But how do you know whether your few bars are reliable indicators of additional gains — a genuine take-off? The move could be a false breakout that ends abruptly. Moving averages are reliable, but it may take many more periods before moving average-based indicators catch up to the new activity burst. The reason to identify good momentum indicators is to get in the trade as early as possible but not get swindled by a false breakout. In addition, many Forex traders trade on an intraday timeframe. Intraday volatility makes measuring momentum far more difficult.
The purpose of this lesson is to define the momentum problems and to offer an overview of momentum indicators. The quest for reliable momentum indicators has occupied some of the best minds in technical analysis. To begin at the beginning, first, you have to think about momentum in terms of acceleration and deceleration. Every price is by definition moving forward in time, either up, down or sideways. If you are not getting higher highs and higher lows—i.e., the prices are horizontal—you have forward momentum but you do not have acceleration or deceleration.
Moreover, just as you may step on the gas to pass another car at 80 mph and then return to a more sedate 55 mph, prices may accelerate for a brief moment but decelerate. Your entire trip could be at an average of 60 mph but from a range of 30 to 80 mph.
The point is that when you seek market information from momentum, you are not looking for averages — you are looking for tipping points.
See the chart below. The lines are hand-drawn linear regression lines that start near the lowest low and end at or near the highest high (or vice versa). The first line on the left (blue) is nearly horizontal, indicating a congestion or range-trading market and neither acceleration nor deceleration. If you look carefully, you will see this period is stuffed full of engulfing bear and engulfing bull candlesticks.
The next line is downward sloping (red) and notice that it does not actually start at the highest high, but rather at a 3-bar congestion area (purple circle). Forget the starting point for a moment and concentrate on the slope of the line, which is significant compared to the blue line's nearly horizontal path. This is what we want, a robust slope. But it is short-lived, and the price series reverses unexpectedly (green line). The high of this move fails to reach the previous highs in the range-trading area where the red downmove began. It is also quite short-lived. Next we get another red downmove that is punctuated by an aberrant spike high (blue circle). The slope of this line is even steeper than the last downmove, suggesting it is fueled by strong sentiment that may burn itself out. Sure enough, the price puts in a lowest low on a doji and the direction changes again, to the upside, albeit at a lesser slope than the previous green upmove.
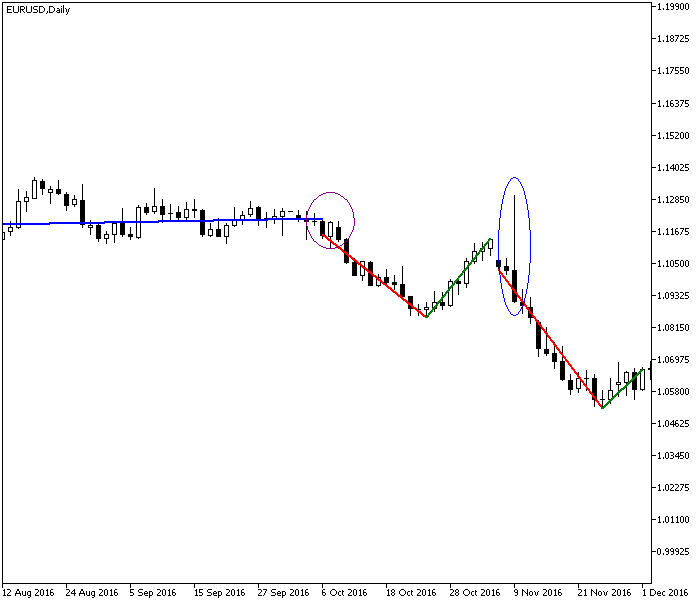 |
| Momentum is displayed by the relative regression line slopes. |
See the next chart, showing the 8-period linear regression slope. The first upmove from Circle 2 shows the slope as robust, but the second one, from Circle 3, looks equally as robust when it seems visually obvious that it is nowhere near as strong a move. We got the different slopes on the body of the bars in the main window by hand-drawing the linear regression from the lowest low to the highest high, but the slope indicator, by using a fixed number of periods, fails to show us the difference.
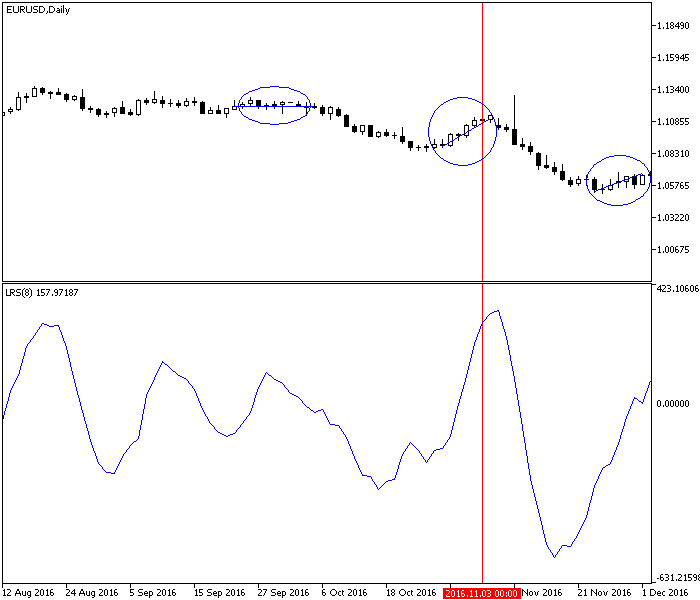 |
| Regression Line Slope indicator as a momentum measure |
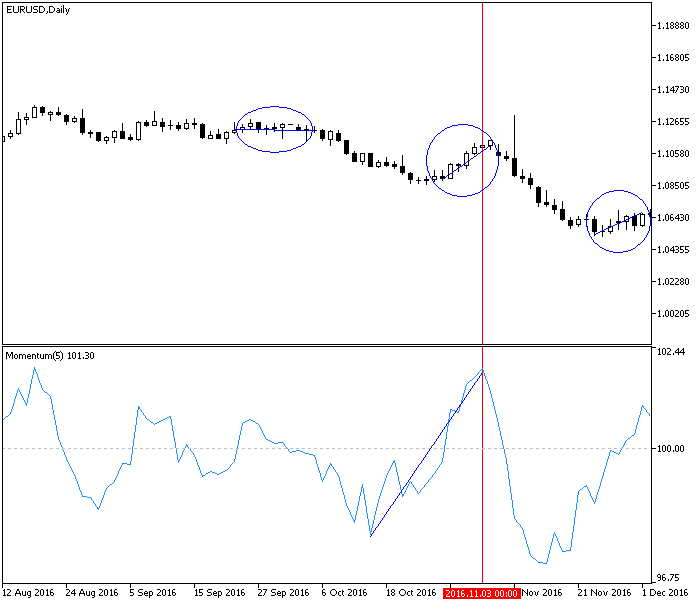 |
| Momentum indicator predicts trend change in price. |
Ah, but there’s a problem, the same problem we had with the slope measurement. How many periods should you put in this momentum indicator? You can backtest to find the optimum parameter until the cows come home and the indicator will still give you a false signal when market sentiment shifts. In some periods, you have big moves and in others, smaller moves. The “normal” size of moves changes over time. Big moves and small moves may be equally trending, but a too-short momentum indicator will get you out of a continuation move prematurely and a too-long momentum indicator will delay your entry into a smaller-bar trend.
One solution is to measure rate-of-change in percentage terms. Rate of change is identical to momentum with the added ability to measure the extent of change. In the chart here, the central line is marked 100, meaning 100%. When the indicator is wobbling around the 100 line, it means today’s price is nearly equal or 100% of the price X number of days ago. When the indicator rises up to 102, you are getting prices 2% higher than when there is no momentum. Different charting packages will display this information with either a zero line or the 100% line.
We know that prices never move in a straight line indefinitely. At some point, the trade gets too crowded — overbought or oversold. Traders take profit, ending the trend, or simply re-think their positions for other reasons. On the previous chart, the overbought judgment kicks in at about 102 and the oversold version at about 97. Most charting software will allow you to draw horizontal lines to mark where you believe the price will be overbought or oversold.
This leads us to the concept of relative strength, meaning internal relative strength and not the strength of one security compared to a different security. RSI was invented by Welles Wilder in the 1978 book, New Concepts in Technical Trading Systems. Before dismissing RSI as old-hat, consider it remains one of the most-used indicators today, not least because in incorporates the concept of overbought/oversold.
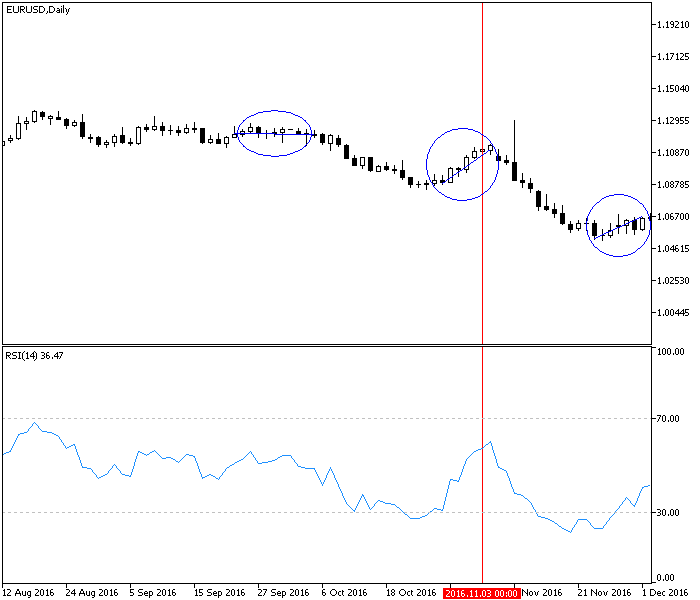 |
| Momentum as measured by relative strength index |
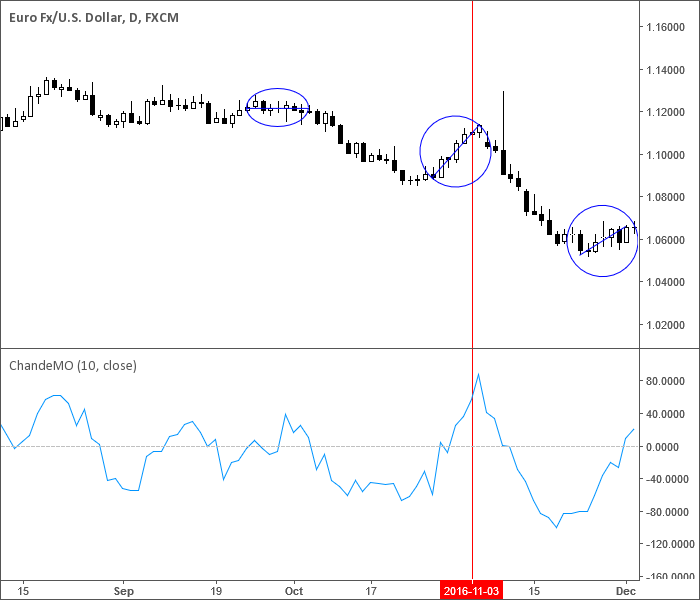 |
| Momentum as measured by Chande momentum oscillator |
If our purpose in using momentum is to discover whether a trend is accelerating or decelerating, or reaching a likely stopping point (overbought/oversold), we can also employ MACD, the stochastic oscillator, and even Bollinger bands. In all cases, we find that bursts of acceleration are limited and usually short-lived. Acceleration may resume or may not, depending on whether the price is overbought/oversold. This helps us pare the parameter to a number most appropriate to whatever timeframe we are using, but do not forget that estimates of overbought/oversold are often wrong.
These four methods of measuring momentum make the case that when acceleration/deceleration is occurring, a momentum indicator will alert you to the change in direction, and sometimes more than one period in advance. Momentum leads direction. All the same, a smart trader also looks at other clues on the bars themselves, such as the presence of many engulfing bull and bear candlesticks in the first congestion area and when the center upmove fails to match-and-surpass the previous highs in the congestion area.
You can use momentum as a stand-alone trading system, but if you do, you should also use other indicators, like patterns and candlesticks. The majority of traders use momentum as a confirming indicator.