That is the only easy thing about parabolic SAR, which was devised by Welles Wilder in the late 1970’s (along with many other core indicators). First, the “parabolic” in the name is only descriptive. The calculation of the indicator does not entail any calculations of parabolas. The indicator just looks parabolic on the chart.
The parabolic SAR is a hybrid indicator that combines direction of trend with strength of trend (i.e., momentum) and derives a trailing stop that is hit when certain criteria are met. You calculate the parabolic SAR by first determining the highest high (for an upmove), named an Extreme Point (EP). To that you add an Acceleration Factor (AF) that starts at 0.02 and adds another 0.02 every time a higher high is met. The maximum the AF can reach is 0.20, no matter how many acceleration periods you have. The Acceleration Factor is calculated by multiplying the difference between the Extreme Point and the previous period’s SAR, and then adding that number to the previous period’s SAR.
In an uptrend, the parabolic SAR trails along under the price bars and moves up with every new bar.
The indicator is demonstrated on the chart below. The parabolic SAR is a single number and therefore is displayed as a dot. On this chart, the blue dots are the parabolic SAR values. Notice that the parabolic SAR is triggered on the third period after a highest high, signifying that the new low is a starting point for the reversal move, and now we should consider the Acceleration Factor to be moving in the opposite direction (downward). Now the parabolic SAR dots are above the price level, denoting that if the price reaches a dot, the downmove has ended and you should stop-and-reverse back to long.
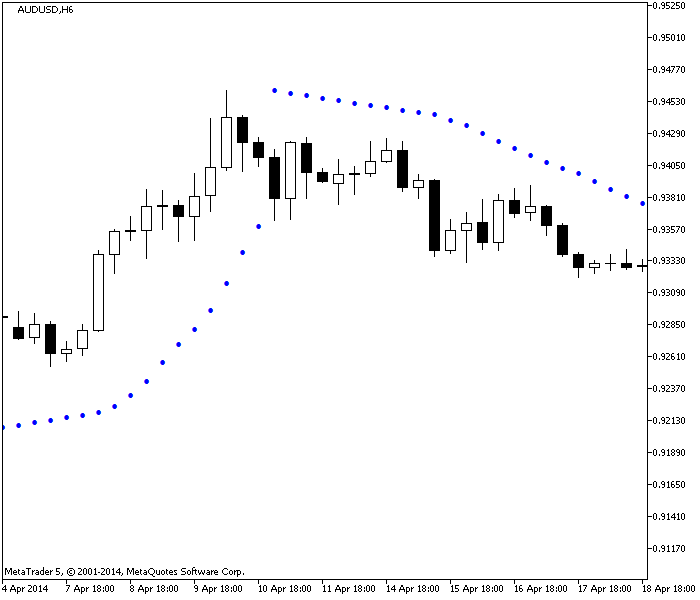 |
| New low triggers reversal. |
Parabolic SAR has several advantages, the first of which is that it delivers a stop at today’s close (or the close for whatever period you are using). Because you do not know the next open, it can be handy to have a stop all wrapped up with a bow before the next session begins. You can use the parabolic SAR as your own stop until you have more information based on fresh data.
The other useful feature of the parabolic SAR is that it warns you to remember that trends can be very short-lived. While parabolic SAR is a lagging indicator, it has a forward-looking capability in that it is intolerant of pullbacks and will generate a reversal when you may think the move is on-going. The move may well be on-going, but the parabolic SAR has a philosophical assumption that only a move that is continuing to go above the latest SAR reading is worth your time and capital.
Another interesting characteristic of the parabolic SAR is that when you draw support and resistance lines by hand, they often line up with the parabolic SAR dots.
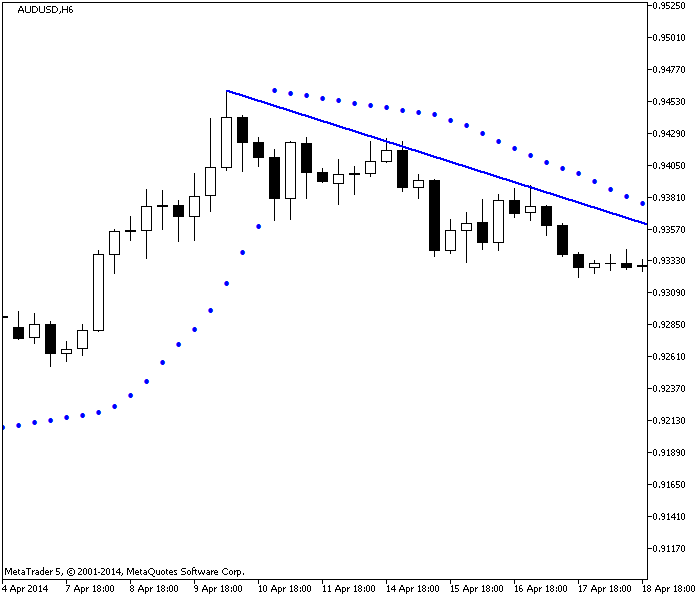 |
| Parabolic SAR complemented with hand-drawn resistance line |
Unfortunately, if you like to look at prices on multiple timeframes, you will get very different parabolic SAR dots. The prices shown in the two charts above are on the same 360-minute chart. Now look at the same prices on the daily chart below. In this timeframe, parabolic SAR has not given up yet and would have you remain long — although notice the lowest low of the last bar is very close to the last dot. This daily chart also includes the Bollinger band. As we observed in the post about Bollinger bands, in Forex, a break of the Bollinger band often — very often — is followed by a pullback. So now you have a puzzle to solve. On the 360-minute chart, the parabolic has you stopping and reversing. On the daily chart, the parabolic SAR has you sticking with the long position, and in addition, you have a reason to put the pullback in context — that high over the B-band top was telling the bulls they had gone too far, too fast.
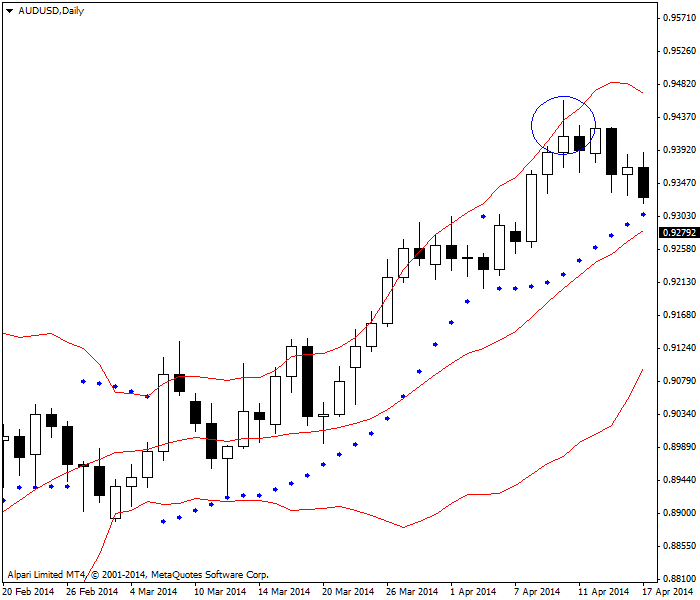 |
| Parabolic SAR with price exceeding the Bollinger bands top (circled) |
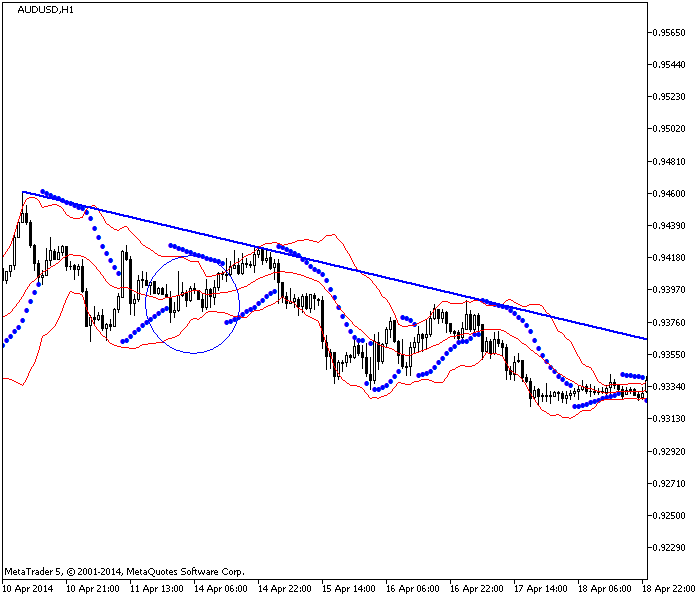 |
| Parabolic SAR is wrong. |
The parabolic SAR works well — generating few whipsaws — on every timeframe but generates fewer whipsaws on longer timeframes, like the 360-minute and the daily. But because of the way it is calculated, it never works well on multiple timeframes. Comparing parabolic SARs across multiple timeframes will always be confusing. One trick is to use the timeframe for your parabolic SAR that is one notch above your trading window. If you trade in the 240-minute timeframe, use the 360-minute for your parabolic SAR. This will help you avoid whipsaws on normal pullbacks.