The calculation technique is deceptively simple. You start with a 20-period simple moving average. Then you have your software calculate the standard deviation of those 20 periods of data, and double it. You add that number to the 20-period moving average to get an upper band and subtract it from the 20-period average to get the lower band. The two bands together outline the maximum limits that your price is likely to reach.
You do not have to understand the exact methodology for deriving a standard deviation because we are lucky enough to have software to do it for us. You do need to understand that the standard deviation is a measure of variability away from a central point, in this case the 20-period moving average. The standard deviation accounts for a very high percentage, about 68%, of the variability of prices away from the benchmark, the 20-period moving average. By doubling the standard deviation, the Bollinger bands account for nearly all the variation away from the moving average, about 95%.
This is why when you get a breakout of one of the bands, it is a statistically rare and abnormal event and worthy of your close attention. Something big is going on in this currency when it breaks a B-band.
Trading Ideas Using Bollinger Bands
Bollinger observed that when a price breaks out of one of the bands, it is an ideal trading opportunity. We expect the price to continue in the direction of the breakout. But in Forex, a B-band breakout is hardly ever followed by much additional movement in the same direction. After two to five periods above the upper B-band, for example, we almost always see the price retrace to the moving average and sometimes all the way to the other, lower B-band. Therefore, in Forex, you might consider that a breakout above an upper B-band is a contrarian indicator. You should be thinking of exiting a long position and perhaps going short.Another idea is that when the price is over the 20-period moving average and headed for the upper B-band, your position is safe until it reaches the upper band, whereupon we expect it to retreat — after all, it is statistically rare and abnormal for the price to exceed is normal dispersal range. The upper band serves as a form of resistance. Similarly, the lower band serves as a form of support.
Another way to see the upper band is as the level at which the currency will be considered overbought, and the lower band as the level where it would be oversold. We do not buy this interpretation or rather this use of the terms overbought and oversold. For one thing, we have better indicators to identify overbought-oversold, like relative strength and the stochastic oscillator, which use the relationships among the bar components (especially the high and the close) to gauge trader sentiment toward current prices. Another reason is that the 20-period moving average is a lagging indicator and is limited to 20 periods.
Big events could have been developing 22 periods back but they would not show up on the current band. Bollinger bands are adaptive by their very nature and offer no anchor or historical perspective. Finally, you can have a series of 40 periods or more of a uni-directional move. That would tend to contract the bands. By definition we assume a central tendency, i.e., that the price will eventually go back to the moving average — but Bollinger bands do not give any clue as to where and when that might be, whereas other indicators are designed specifically to deliver that information.
See the chart below showing the Australian dollar with a Bollinger band. Many of the instances of the price breaking the Bollinger band are circled — and note the breakouts last no more than five days and usually only one or two. After a breakout, the price moves toward the other band.
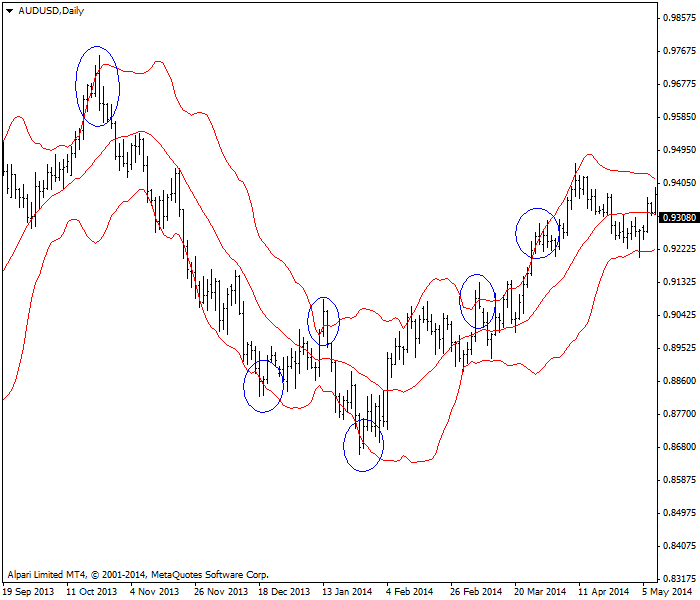 |
| AUD/USD daily chart with Bollinger bands breakouts circled |
The Volatility Component
When the two bands are fairly close together, clearly the price is not varying by much away from the benchmark 20-period moving average. For purposes of Bollinger band analysis, we consider the 20-period moving average a “norm.” A tight band means low volatility. When a normal width band contracts and becomes a tight, narrow band, it means the traders in that currency pair are undergoing a period of uncertainty.Bollinger calls it the squeeze, and the squeeze almost always precedes a breakout. You do not know from the Bollinger bands in which direction the breakout will occur. To figure that out, you need to look to other indicators. However, you have been warned — a narrow Bollinger band is the time to be paring your positions, not adding to them or betting the ranch.
The next chart is showing a classic Bollinger band on AUD/USD with three instances of a squeeze – each one followed by a change in direction.
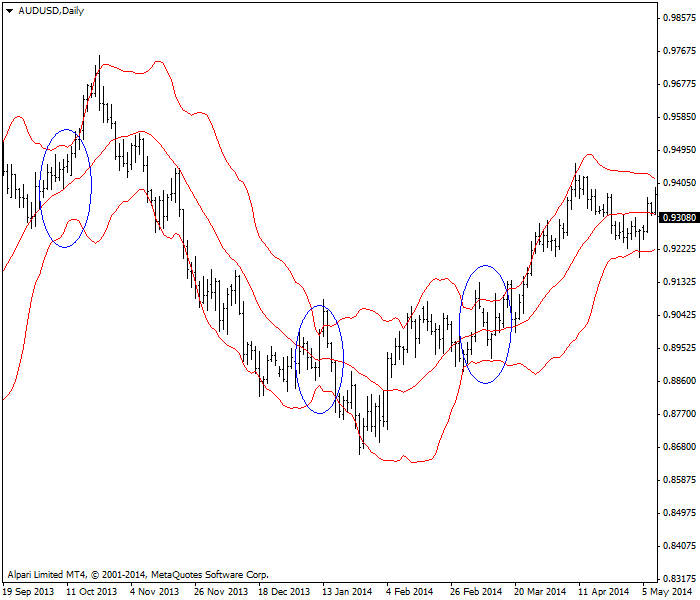 |
| AUD/USD daily chart with Bollinger bands squeeze zones circled |
When the bands are relatively far apart, it means volatility is high. If you have good directional evidence of a rally or a rout, high volatility is not a worry because we expect a trend to continue in the same direction until something comes along to disrupt it. However, consider that you would also get wide bands in an untrended but spiky price series. When traders are of wildly different views on where a price should go, you can see a spike high that may be over 100 points from a spike low only two hours or two days later.
The next chart depicts the euro on a one-hour basis. You see a narrow band widening out to a wide band on a spike high followed by a spike low, but you would be hard-pressed to say there is any directional trend on this chart.
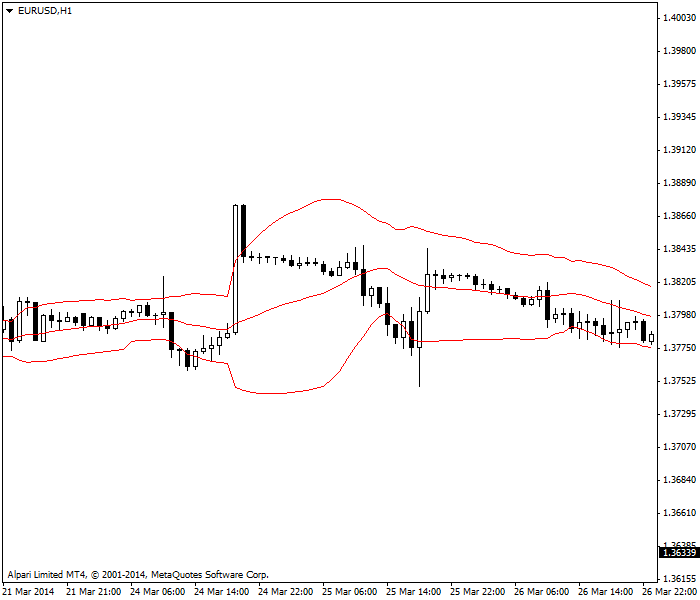 |
| EUR/USD hourly chart with Bollinger bands widening |