MACD is the single most reliable indicator in Forex on the daily chart. That does not mean it is the best trading guide, since most traders are not trading on a multi-day timeframe, but it does mean that when you trade contrary to the daily MACD signal, you should have a good reason.
The core MACD concept takes a little getting used to. First, you subtract a long-term moving average (26-day exponential) from a shorter moving average (12-day exponential). This sounds backwards until you realize that if today’s prices are higher than the prices 26 days ago, your line is rising. That is the trend. However, for trading purposes, you need a signal generator, and that comes from a 9-day moving average of the MACD line you just built. When the signal line crosses the indicator line to the upside, it means your trend has accelerating momentum.
MACD Line = EMA12 - EMA 26
SIGNAL LIne = EMA9 (MACD Line)
If you are a backtester, you are welcome to try other combinations of numbers. If you cut the number of periods in the moving averages, you will get a more responsive indicator. You can also apply MACD to charts other than the daily, like the 4-hour. Below the 4-hour, MACD’s famous reliability starts to fade.
If you are going to use only one indicator on your charts, you should choose this one.
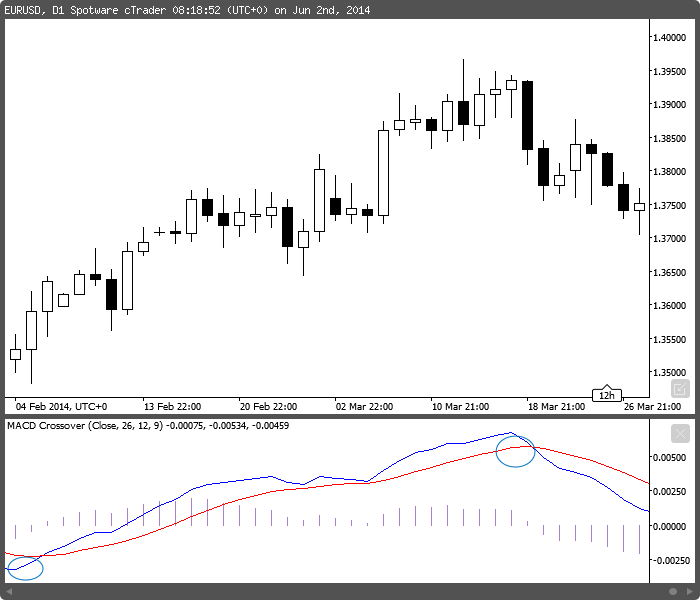
MACD is always displayed in its own window. You can see the example chart below. The blue line is the MACD line and the red line is the signal line. This chart has two crossovers (arrows), both indicating that the change in direction should continue. In the second crossover, you can see the big pair of down-bars are followed by a small upside pullback — but the crossover is decisive and in fact, the pullback is your opportunity to add to a short position or to get in fast if you were late to the MACD party.
 |
| MACD example chart with two trading signals |
The Zero Line
The zero line forms when the 12-day EMA is exactly equal to the 26-day EMA. When the MACD line crosses above the zero line, it means the 12-day is higher than the 26-day and therefore the sign is positive. This is the buy signal. And when the MACD line crosses below the zero line, it is a sell signal. This means the MACD indicator actually gives you two buy/sell signals — the zero line crossover and the signal line crossover.There is a certain amount of controversy surrounding whether you need both the MACD signal crossover and the zero line crossover. Traders in a hurry to put on a trade will take the signal crossover whether the zero line is crossed or not — or the zero line crossover whether there is a signal line crossover or not, and perhaps add to the position once the other buy/sell criterion is met. Risk-averse traders want both and will wait for the other crossover, possibly risking the gain to be had from the first part of the move (where gains tend to be bigger in Forex because of the bandwagon effect). It is important to remember that the signal line, as a 9-day moving average of the MACD line, is by its very nature a lagging indicator, and a lagging indicator that trails another lagging indicator. Depending on the currency and conditions, you may get the zero line crossover several periods sooner than the signal crossover, or you may get the signal crossover faster than the zero line crossover.
Convergence and Divergence
The terms convergence and divergence refer to the MACD line and signal line, but you can refine your use of MACD beyond the buy/sell signal. When the MACD line is continuing to rise but the underlying price bars are already falling, you assume upward momentum has been lost and want to be on the lookout for a signal change. However, beware — a bearish divergence like this can easily occur in an uptrend. You may still have a strong uptrend, and MACD is merely telling you that initial momentum is fading a bit.MACD is not used for identifying overbought and oversold levels, for which we have other specific indicators, but you will observe that the MACD line tends to peak and bottom at certain levels on any particular timeframe. Since the MACD line is literally an arithmetic line and not standardized to oscillator form (i.e., with a base of zero to 100), this is an interesting oddity. You will also notice that like any other moving average indicator, MACD is the most effective in a trending market. When your currency is trading sideways in a narrow range, MACD is not as useful as other indicators.