A candlestick bar emphasizes the open and the close rather than the high and the low, as in regular bars. The candlestick consists of a rectangle named the real body. The high and low are depicted by vertical lines projecting from the top and bottom of the real body. These are named shadows, although you will also see other names, like wick (as in candlewick), and tail.
The top of the real body is either the open or the close, and you know immediately whether sentiment was positive or negative because if the real body is white, the close was above the open. A black candle means the close was lower than the open. When you see a series of white candles, you know that this means the close is consistently higher than the open, and conversely, a series of black bars implies on-going negative sentiment.
As noted in the lesson on the Candlestick Chart,
you may also see the bars colored green and red or some other
combination of colors, with the darker version always denoting a lower
close and the lighter version always denoting a higher close. Some
writers call the white candlestick “hollow” and the black candlestick
“filled.”
As you can see on the two figures below, a black candlestick and a
white one are identical in every way except the open and close are
reversed: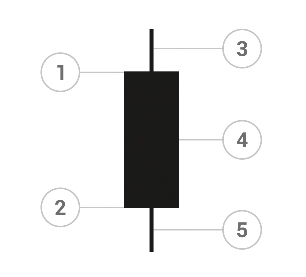 |
| Black (bearish) candlestick |
1
Open;
2
Close;
3
Upper shadow;
4
Real body;
5
Lower shadow.
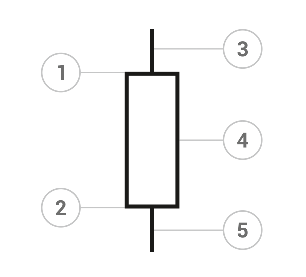 |
| White (bullish) candlestick |
1
Close;
2
Open;
3
Upper shadow;
4
Real body;
5
Lower shadow.
Size Matters
The bigger the real body, the more buying or selling pressure. A short candlestick means not much action either way. A small real body implies a lack of directional conviction by traders. A candlestick named the doji has the open and close the same or nearly the same, signifying indecisiveness.The length of the shadows may matter too. The upper shadow reflects the high of the period, and the lower shadow the low of the period. Short shadows indicate the trading action was clustered between the open and close. The absence of any upper shadow means the price closed at the high, and that always means strong bullishness and probably a next bar that favors being long. Similarly, the absence of any lower shadow means the price closed at the low and that is always a pointer to a lower open and probably a lower low.
A long upper shadow mean that bulls tried to get a rally going but failed. The currency closed well under the high. Similarly, a candlestick with a long lower shadows shows that bears failed. They got a lower low but failed to get the currency to close there. Long shadows are especially useful in Forex for exactly this reason — to show which side, so to speak, is losing.
The chart below shows a "fight" between the bulls and bears. First, we see a long upper shadow on a black candlestick with a far lower close than the preceding bars. This is a surefire indication that bulls, who had been winning and getting higher highs and closes for over two weeks, have lost it. Sure enough, the next bars are black and embody a series of lower lows and lower closes. But then we get a bar with a long lower shadow. The selling power of the bears is exhausted. The bar is still black — the close is under the open — but the move is going to pause. If you had been a seller on this move, you might want to exit here. Note that the long lower shadow does not necessarily mean the downtrend is over. It may resume after the pause (or retrace upward). The long lower shadow does not tell us what comes next, just that this particular series is ending. Note that two periods later, we get a white candle with a higher high and higher close.
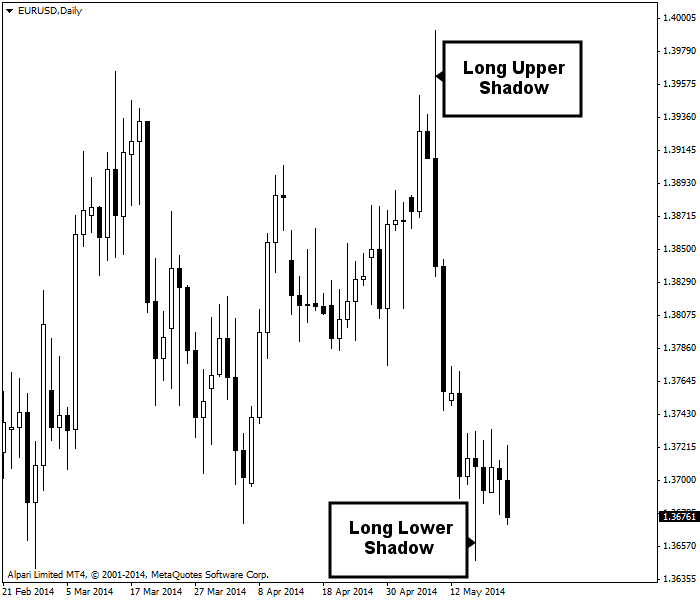 |
| Long upper shadow and long lower shadow signal the end of trends. |