A classic example is when the 10-day crosses above the 20-day, you should buy. You should sell when the 20-day crosses the 10-day to the downside. We have been observing this particular moving average daily on multiple Forex charts combination since 1979 and can affirm that it is a reliable indicator of direction change in Forex more than half the time. Some technical analysts apply the word “breakout” to the crossover.
The example chart below is showing the blue 10-day moving average plotted against the red 20-day. This chart has five crossovers and one apparently about to occur at the end of the price series. There is an interesting space near the center of the chart where the blue 10-day rises to approach to the 20-day but it does not actually cross it. Each trade on this chart would have been profitable. Note that most charts of this duration will have at least one or two whipsaw losses.
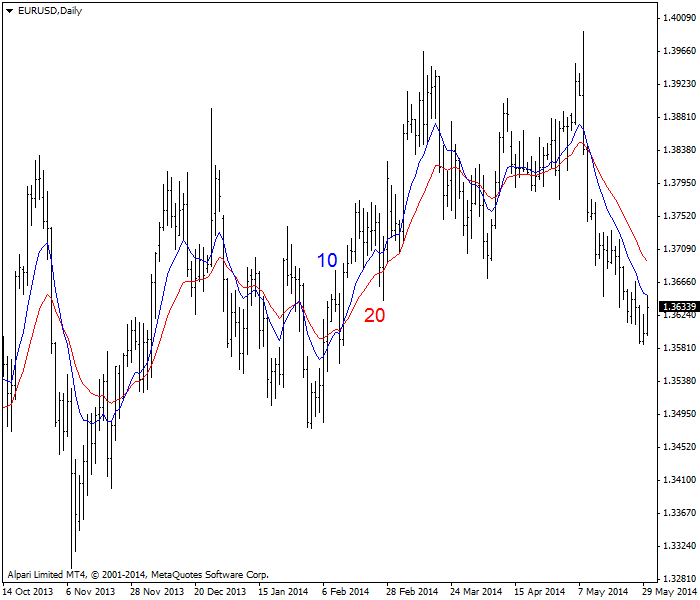 |
| Chart example with 10-day and 20-day moving averages crossover |
You are free to experiment with other combinations of moving averages, especially if the 20-period delivers too many whipsaws. Raise it to 22 periods. Some traders try to game the market by using oddball combinations, like 7 and 13, or 15 and 30. Be aware that there is no magic combination for a single currency or across all Forex prices. All moving average combinations deliver whipsaw losses and they all lag the real action.
Fractals Again
The 10 and 20-day moving average combination is a classic regime – on the daily chart. You are probably using charts with the daily timeframe, 4-hour timeframe, and the one-hour timeframe. Note that the 20-period has magic properties on all timeframes, even the one-hour.This is not so mysterious if you stop and think about it. The 5-day is a week of trading days. The 10-day is two weeks. The 20-day is not quite a month (which is actually 22 days), but it is close enough for rough estimates. On the hourly chart, the 20-period is nearly a full 24-hour cycle. For some reason, prices are magnetically attracted to the 20-period moving average and the price breaking the moving average line often has real meaning, not least because you know that in a two moving average trading system, the price is going to drag the 10-day moving average down with it — unless a low is an aberrant spike. Sometimes the price will be repelled at only a point or two away from the 20-period. This occurs more often than chance would allow.
The important point is that you can get a perfectly acceptable trading system using the two moving average trading system in any timeframe. See the next chart, which is showing the EUR/USD on the two-hour (120-minute) timeframe. Again we see the blue 10-period MA crossing above the 20-period on the left-hand side of the chart, then a downside crossover, and after that, resumption of the upmove. Notice that the price does not cross the 10-day until four periods (or 8 hours) after the highest high, and you do not get the 10-day crossing the 20-day until another 4 periods after that, or a 16-hour delay in getting a confirmed sell signal.
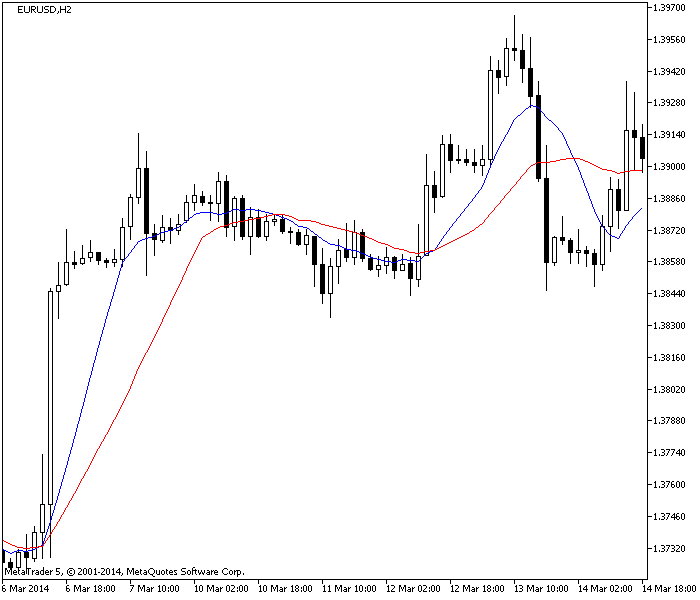 |
| Chart example with 10 and 20-period moving averages crossover on H2 timeframe |
Moving Average Ribbon
Why not put a whole slew of moving averages on one chart? This idea was put forward by Daryl Guppy and is named the moving average ribbon. The following chart illustrates the concept. The moving averages on this chart number 12, with each one adjusted a fixed number of points above and below the 20-day.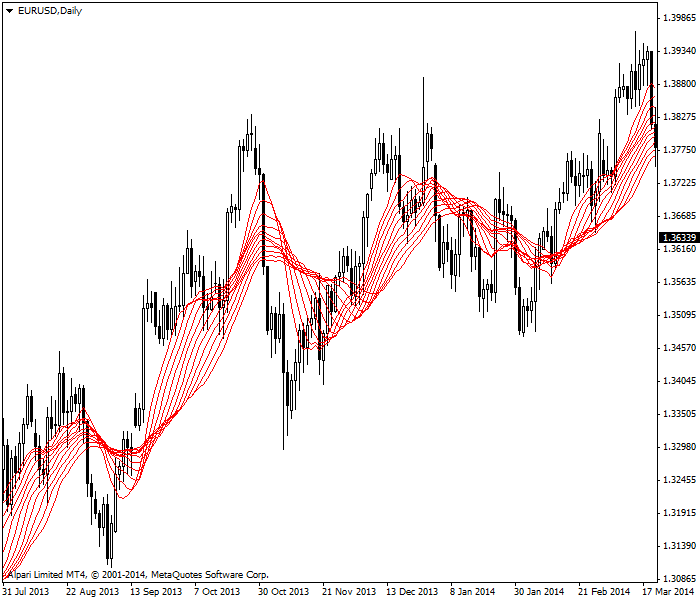 |
| A ribbon of 12 moving average indicators |
As you can see on the chart above, there is a lot of daylight between lines on the left-hand side of the chart. The price has dipped sharply, but the strands of the ribbon are wide apart — traders do not agree. Sure enough, the upmove resumes and in the center of the chart, the ribbon strands get very close together and are running in parallel. By this point, the price is well above all the moving averages, and the ribbon has tightened down to a thin collection of lines. If you did not already have a position and are deeply risk-averse, that narrowest point is a confidence-builder that buying right here is a good idea. And the decision would be vindicated by the price making a new highest high right afterwards.
The moving average ribbon is an intriguing idea. It is probably more useful as a sentiment indicator than a trading guide.