Range refers to the high-low range of a bar of any timeframe — hourly, H4, daily, whatever. Wilder named it “true” range instead of plain old “range” to account for gaps. Because the Forex market is nearly 24 hours per day, we get daily gaps mostly on Sundays when Asia is the first session to open up after Friday’s New York close, although we do sometimes get gaps on other occasions (such as central banks releases and important data releases like US payrolls). We also get gaps on timeframes shorter than one day. Actually, we get gaps on all timeframes, but they are noticeable only on lower timeframes.
If you do not have a methodology to account for gaps and you have two periods in a row with the exact same high-low range in terms of numbers of points, you will miss that in-between the two bars, something important happened. Gaps are not accidents. Gaps appear because a new piece of information has arrived on the scene that causes sentiment to jump, literally. If you were willing to buy EUR/USD at 1.3500 but waiting for 1.3490, and new wildly pro-euro data comes out, you will change your bid to 1.3525. The very existence of the gap informs other traders that something big has happened. Not every gap sets off a bandwagon, of course, but a new wave of buying or selling ensues from a gap more than half the time. Remember that it may not be long-lasting, though.
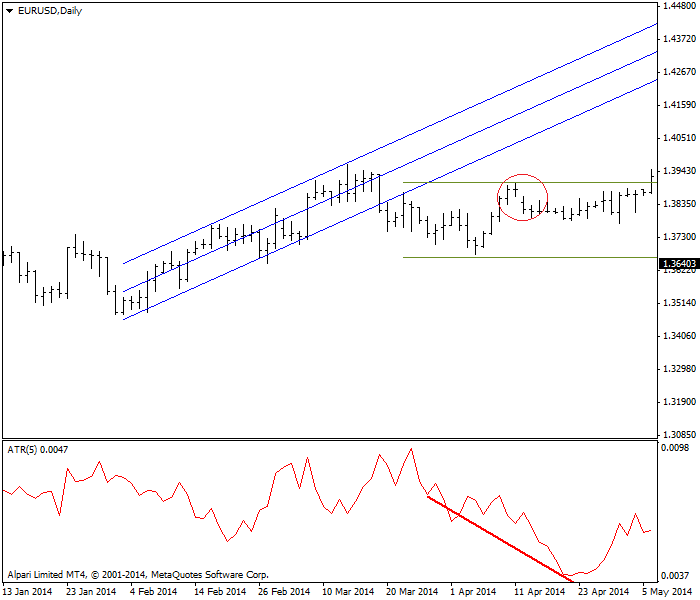
Before getting into the arithmetic of ATR, consider the ATR as an indicator. The chart below shows a 5-day ATR and after the uptrend in the price falters. The ATR starts falling and keeps falling even after the price stops falling and recovers a little. The falling ATR is a warning that the currency is in a sideways trading range, marked by gold horizontal lines.
The point: falling ATR values mean the market is indecisive and non-trending. When EUR/USD is trending, that 5-day ATR is about 80 points. After the breakout to the downside, it falls to about 44. Notice that there is a downside gap right after the highest high fails. By drawing the horizontal lines, we deduce that the price has to surpass that previous highest high and “close the gap” before we can assume the uptrend is resuming. Near the right-hand side of the chart, ATR is rising again, showing more action in this currency, but rising ATR alone is not a reason to buy — yet.
 |
| ATR indicator with linear regression and a sideways range. The price gap is circled. |
Wilder’s Average Directional Movement indicator (ADX) uses ATR in the formula to incorporate the range concept. Displaying ATR alone is just a more direct way to estimate the degree of market participation in a move. A big ATR number means lots of trading is going on. A falling or low number means participation is low, and low participation usually precedes a breakout, although it does not tell you in which direction.